Getting Started: Run Your First Test with FieldLab Mobile
This guide walks you through connecting a gauge, logging data, and retrieving a completed test run.
This walkthrough uses a single gauge, but FieldLab Mobile supports multiple gauges and readings in a single test.

The following guide applies to FieldLab Mobile app versions 2.0 and later.
Before You Start
Make sure the following are in place before you begin:
1. Install FieldLab Mobile.
Download from the Apple App Store (iOS) and the Google Play Store (Android). Search for “FieldLab Mobile” by Ralston Instruments.
Download from the Apple App Store (iOS) and the Google Play Store (Android). Search for “FieldLab Mobile” by Ralston Instruments.
2. Connect the Bluetooth antenna.
Screw the included Bluetooth antenna into the SMA connector on the back of your Field Gauge.
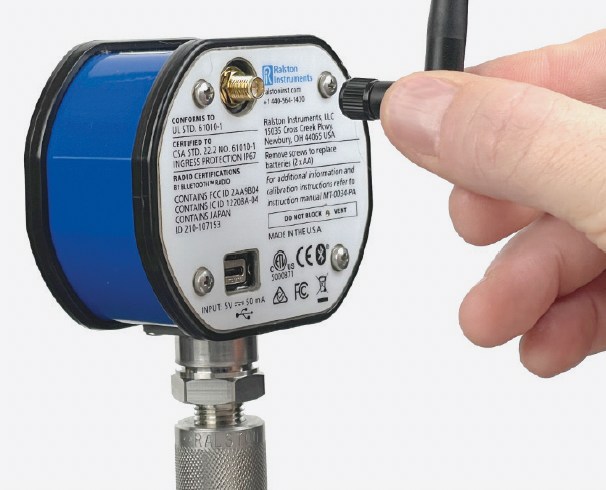
Screw the included Bluetooth antenna into the SMA connector on the back of your Field Gauge.
3. Power on and zero the gauge.
Press the power button on the front of the gauge. If you're using a pressure gauge, press and hold the zero button to zero the gauge.
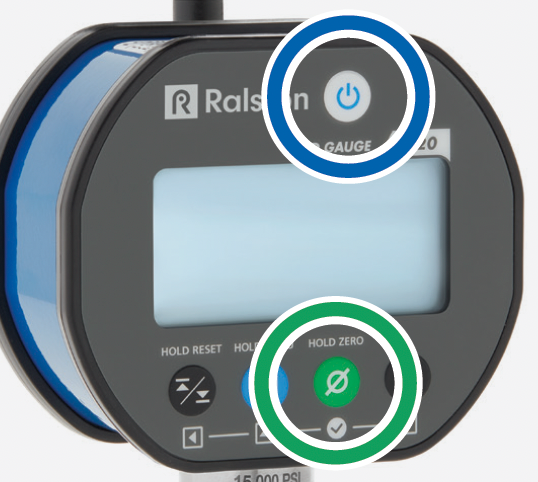
4. Allow Bluetooth access for the FieldLab Mobile app.
The first time you open FieldLab Mobile on your phone or tablet, the app will ask permission to access Bluetooth. Tap Allow. The app needs Bluetooth to communicate with your gauge.
Add a Pressure Reading
When you open the FieldLab Mobile app for the first time, you will land on the Test screen.
1. On the Test screen, tap Add Reading.
2. Choose a reading type.
For this walkthrough, tap Pressure.
For this walkthrough, tap Pressure.
3. Tap "Tap to link gauge" at the bottom of the reading card.
4. Tap the Link button.
This screen will display a list of nearby, powered-on Ralston Bluetooth-enabled gauges that are not yet linked to the Test. For this demonstration, there is only one gauge.
Once linked, the reading card displays the gauge's live pressure value.

A note on sensor labels: Ralston gauges are manufactured with either one or two sensors. Each sensor is identified by a letter. A for the bottom sensor and B (if present) for the top sensor. On dual-sensor gauges, these letters coincide with the laser-etched labels on the physical gauge's sensors.
Configure Your Test Settings
Set the logging interval, change pressure units, and name your test.
1. Tap Test (the gear icon in the upper-right corner of the Test screen) to open the Test Settings screen.
2. Name your test (optional).
Tap Name to give your Test Run a custom name.
This name will appear as the header for your exported test data. If you skip this step, the Test Run will be saved as “Untitled Test.” You will have the opportunity to change the name later once your Test Run is completed.
Tap Name to give your Test Run a custom name.
This name will appear as the header for your exported test data. If you skip this step, the Test Run will be saved as “Untitled Test.” You will have the opportunity to change the name later once your Test Run is completed.
3. Set the logging interval.
The logging interval determines how frequently FieldLab Mobile records a data point during your test. The default interval is 1 minute. Keep in mind that a shorter interval logs more data points per minute, which can use up gauge memory faster. You’ll see exactly how this affects your available logging time in the following steps.
Tap Interval to access the Logging Interval menu and make your selection.
When you’re done, tap Back to return to the Test screen.
Change Pressure Units
Optional. Ralston pressure readings default to psi.
1. Tap the Reading card
Tap anywhere on the card to access the reading details screen.
2. Tap Reading (the gear icon in the upper-right corner of the reading details screen)
3. Tap Unit, then tap the pressure measurement unit you need to use for the test.
4. Optional: Name your reading
The Reading name will appear in your test data and on the final chart. It is especially helpful to name your Reading when you have 2 or more variables in your Test Run.
If you skip this step, FieldLab Mobile will apply the default reading names to your test results. "Pressure" for pressure readings, and "Temperature" for temperature readings.
Tap Name to access the edit field and name your reading.
Example of custom reading names in a Test Run exported as a PDF file
The example below was created by linking & logging two temperature readings and one pressure reading using the FieldLab Mobile app, and shows a cropped view of the multi-page PDF exported from FieldLab Mobile.
5. Tap Back to return to the reading details screen
6. Tap X in the upper-left corner of the reading details screen to return to the Test screen.
Start Your Test
1. On the Test screen, tap Start Logging.
2. Review available gauge memory
FieldLab Mobile checks the gauge’s available memory against your configured interval and displays the maximum amount of time you can log. For example, at a 10-second interval, the gauge in this walkthrough can log for up to 2 hours and 26 minutes.
FieldLab Mobile checks the gauge’s available memory against your configured interval and displays the maximum amount of time you can log. For example, at a 10-second interval, the gauge in this walkthrough can log for up to 2 hours and 26 minutes.
If your test requires more time than what’s available, tap View Test Settings to increase the interval, which extends the available logging duration.
3. Tap Start Logging to begin your Test Run.
Once logging starts, the screen updates to show the elapsed time under Running for, and a red Stop Logging button at the bottom of the screen.
Stop Logging and Import Your Data
1. When your test has reached the required duration, tap Stop Logging.
A confirmation dialog appears: “Are you sure you want to stop logging?” This safeguard prevents accidental interruptions. Tap Stop to end the test, or tap Continue to keep logging.
After you stop logging, FieldLab Mobile automatically imports the logged data from the gauge. A progress screen walks through each step: Stopping the log, retrieving data from the gauge, processing, and saving. When you see Test Complete, your data has been saved.
2. Tap View Test Run to review the results, or Close to return to the Test screen.
Export Your Test Data
1. Tap Test Runs
All of your imported tests are saved in Test Runs until you delete them.
2. Tap the Test Run you want to export
3. (Optional) Customize the names in your test data
3a) Customize the test name
The default test name is "Untitled Test". You can customize the name to:
- Make your exported test reports more informative and professional-looking.
- Make your exported test files easier to find later. The custom name you create will become part of the file name on the export.
3b) Customize the Reading name
The custom name you create will be appended to the exported data within the file. The default names for pressure Readings are "Pressure" and for temperature Readings, "Temperature". You can customize the name of the pressure reading, for example, to specify the device that was being tested.
This is especially helpful when you perform a test with multiple readings. For example, a hydrostatic test may have one pressure reading for the vessel, a temperature reading for the vessel, and a temperature reading for ambient temperature.
4. Tap Export
5. Tap the format you want your data exported in
- CSV. Comma-separated data file for use in spreadsheets or analysis tools.
- JSON. Machine-readable test data for use with custom software, databases, or automated workflows.
- Graph. A PNG image of the chart, for use in your own test reports.
- PDF. All test info plus the graph in a formatted, print-ready document.
- Export All. Includes all of the above file formats in a ZIP file.
6. Save or share the file
Your mobile operating system will offer you a range of options for exporting the data. The options available to you will depend on:
- The mobile operating system you are using (iOS or Android).
- The 3rd-party apps you have installed on your device.
Some common ways files are saved or shared:
- Upload to a cloud app such as Google Drive or Microsoft OneDrive
- Attach to an email