Log pressure and temperature on your computer with one or more Ralston gauges
This article applies to the following devices:
- Field Gauge LC10, all models
- Field Gauge LC20, all models
- Process Meter LC30, all models
- FieldLab Digital Pressure Calibrator, all models
Things you will need:
- A PC running Windows.
- FieldLab Desktop software version 1.40.4.0 (or later) installed on your PC. Update FieldLab Desktop to the Latest Version
- One or more (up to five) FieldLab, Ralston Field Gauge, or Process Meter.
- If using a FieldLab, it will need firmware version 1.126 or later. Update Gauge Firmware
- Field Gauge LC10, LC20, and Process Meters will need firmware version 1.008 or later. Update Gauge Firmware
- Provided USB cord for wired connections between your gauge(s) and your computer.
- Wireless dongle if you want to connect wirelessly with a FieldLab Pressure Calibrator.
Establish wireless and/or USB connections between FieldLab Desktop and the Ralston Gauges.
Select "Data Logging" in FieldLab Desktop.

Select the process variables you want to log
Connected devices will appear at the top of the list in bold. Select the check box next to each one you want to include in the log session. You can add up to five devices to the log session.

Select 'Add to log session' once you have selected your devices.

Review and customize the log session Settings (optional).
Select the Settings button to review and customize the following settings for your logging session:
- Pressure Units
- Temperature Units
- Session Duration

Start logging

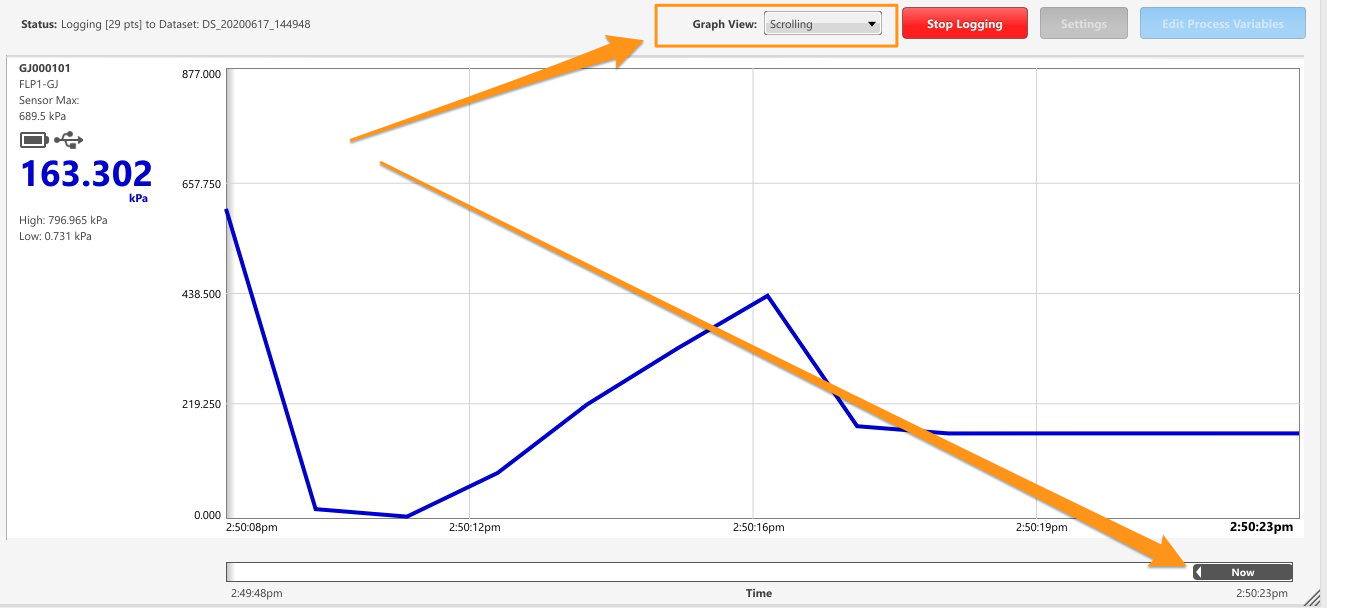
GRAPH VIEW
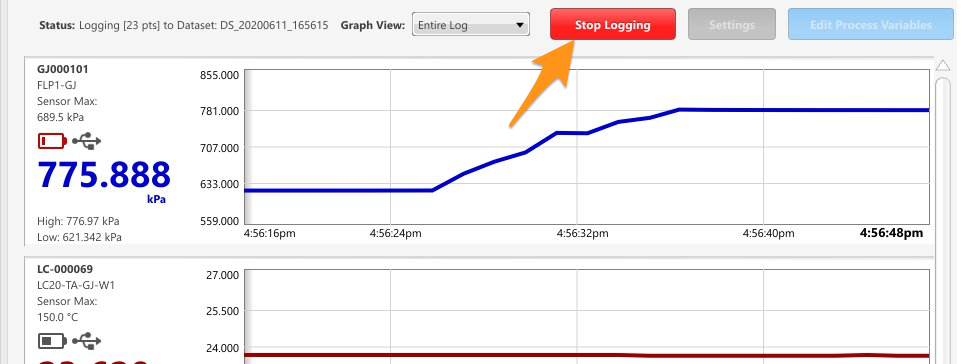
Entire Log
Setting the Graph View selection to "Entire Log" will show all the graph data from the time you started logging.

Scrolling
When you select "Scrolling", only the most recent graph data will be shown, and older graph data will scroll off the left side of the screen as time progresses.
You can use the slider tool at the bottom of the screen to scroll back and view older graph data.
Stop Logging
Select the Stop Logging button to stop saving data to your computer. Live graph data will continue to be visible.
View and export data from the logging session
Select Data Sets to view the saved data from your log sessions.

You can view and export your data sets in .pdf or .csv formats from this screen. For full instructions, go to the support article: Export Data Sets from FieldLab Desktop.
Related Articles
Log pressure and/or temperature data to your computer with FieldLab Desktop
This article applies to the following products: Field Gauge LC10, all models Field Gauge LC20, all models Process Meter LC30, all models FieldLab Digital Pressure Calibrator, all models. Things you will need: A PC running Windows. FieldLab Desktop ...Calibrate the temperature sensor on a Field Gauge
Do-it-yourself instructions for calibrating a Field Gauge with free FieldLab Desktop software. At the end of this process, FieldLab Desktop will compare the readings from your Reference device and Field Gauge (Zero, Mid Point, and Full Span), and if ...Connect one or more Ralston gauges to FieldLab Desktop App with Bluetooth
What you will need: One or more Bluetooth-enabled Ralston Gauge. How to tell if your Field Gauge has Bluetooth. The FieldLab Desktop app installed on your Windows computer. Version 1.40.4 or later. Update FieldLab Desktop to the Latest Version. 1. ...Create a Custom Pressure Unit with a User-Defined Curve Fit
Things you will need: The FieldLab Desktop app on your Windows computer. Version 1.40.4 or later. Update FieldLab Desktop to the Latest Version. A Ralston FieldLab Digital Pressure Calibrator, Field Gauge, or Process Meter In the FieldLab Desktop ...Run a Calibration Test on another device from your computer with a Ralston Gauge
Use a Ralston Gauges as a reference to calibrate other devices. Calibration Tests can be run right from your computer with Benchtop Calibration. This article applies to Ralston Field Gauge and FieldLab, all models with a pressure port. Minimum ...
Recent Articles
Find the serial number and model for your gauge
Located on the external casing of your Field Gauge All Field Gauge LC20 and Process Meter LC30 gauges are shipped with a custom sticker that contains the following information. Model Number. Model numbers ending in B1 or W1 indicate the gauge has a ...Troubleshoot USB Power Noise Causing Pressure Reading Drift on a Ralston Gauge
Problem Unexpected pressure reading changes on an Ralston LC gauge when connected via USB. Root Cause Electrical noise is introduced through a low-quality USB hub and power supply interference. Noise from switch-mode power supplies (SMPS) can travel ...Adjust Damping on your Ralston Gauge
Damping slows the visual updates of a pressure gauge’s reading. The goal is to minimize minor fluctuations of the pressure reading on the screen caused by subtle variations in pressure that may create unwanted visual noise. Ralston gauges are set to ...Register your Ralston Gauge
Register your Ralston gauge to access calibration certificates and install firmware updates. This article applies to: FieldLab, Field Gauge LC10, LC20, and Process Meter LC30, all models. Things you will need: A PC running Windows. FieldLab Desktop ...Look Up Lead Time and Pricing for a Ralston Product
Go to ralstoninst.com Sign in to your Ralston account Select "Look Up Pricing and Lead Time by Model Number" Enter the model number of the Ralston product View the search results For each model number in your search results, info will be provided ...